Table of Contents
- 1 What is the dividend yield ?
- 2 How is dividend yield calculated?
- 3 Why is dividend yield important?
- 4 Examples of Dividend Yield
- 5 What does dividend yield tell me, and how can I benefit from it when picking stocks to invest in?
- 6
- 7 Is a High Dividend Yield Good?
- 8 Which Stock Has the Highest Dividend Yield?
- 9 Advantages and Disadvantages of Dividend Yields
- 10 What was the effect of dividends on the RSISXTR Index in 2024?
- 11 Dividend Yield vs. Dividend Payout Ratio
What is the dividend yield ?
The dividend yield shows the percentage of income earned from a dividend compared to its share price on the ex-dividend date. In Iraq, this date is the last trading day before the Annual General Meeting (AGM), where dividends are decided.
How is dividend yield calculated?
For example:
Company A decides to distribute a 70% cash dividend (IQD0.70 cash dividend per share)
Ex-dividend date closing price: IQD5.00,
Dividend yield formula = Dividend per share / Ex-dividend date closing price
= IQD0.70 / IQD5.00 = 14%
As a result, if your portfolio invested in Company A was valued at IQD1,000,000 before the AGM, you would receive a total cash dividend of IQD140,000 (=1,000,000 × 14%). (For the 5-year dividend history of each stock including dividend yield calculations, please refer to Rabee Securities’ Research Department’s Quarterly “Dividend Report (ISX-listed Companies)”)
Why is dividend yield important?
The question is not only ‘What is dividend yield?’ but also ‘Why is it important?’ Dividend yield is important because it is a standardized ratio that allows you to compare the returns from investments in different companies, each with varying share prices and dividend distributions.
Examples of Dividend Yield
In the example below, Company Y pays a lower cash dividend per share, but its dividend yield is higher than Company Y. If you were holding both shares before their AGM, you would receive more dividend income in Iraqi Dinars from your investment in Company Y. As a result, you should always compare companies based on their dividend yields, not based on the cash dividend paid per share.
| INVESTED EQUAL AMOUNTS TO BOTH COMPANIES | |||
| Formulation | Company X Vs. Company Y | Company X | Company Y |
| a | Value of the Portfolio before the AGM (IQD) | 1,000,000 | 1,000,000 |
| b | Cash Dividend Per Share (IQD/Share) | 0.700 | 0.400 |
| c | Ex-Dividend Date Closing Price (IQD/Share) | 5.000 | 2.000 |
| b/c=d | Dividend Yield (%) | 14.0% | 20.0% |
| a*d=e | Dividend Income (IQD) | 140,000 | 200,000 |
| b | Cash Dividend Per Share (IQD/Share) | 0.700 | 0.400 |
| f | Number of Shares Owned | 200,000 | 500,000 |
| b*f | Dividend Income (IQD) | 140,000 | 200,000 |
| Second formula for Dividend Yield Calculation | |||
| a | Value of the Portfolio before the AGM (IQD) | 1,000,000 | 1,000,000 |
| e | Dividend Income (IQD) | 140,000 | 200,000 |
| e/a | Dividend Yield (%) | 14% | 20% |
(For the 5-year dividend history of each stock including dividend yield calculations, please refer to Rabee Securities’ Research Department’s Quarterly “Dividend Report (ISX-listed Companies)”)
| INVESTED DIFFERENT AMOUNTS TO COMPANY X AND Y | |||
| Formulation | Company X Vs. Company Y | Company X | Company Y |
| a | Value of the Portfolio before the AGM (IQD) | 1,000,000 | 500,000 |
| b | Cash Dividend per share (IQD/Share) | 0.700 | 0.400 |
| c | Ex-Dividend Date Closing Price (IQD/Share) | 5.000 | 2.000 |
| b/c=d | Dividend Yield (%) | 14.0% | 20.0% |
| a*d=e | Dividend Income (IQD) | 140,000 | 100,000 |
| b | Cash Dividend per share (IQD/Share) | 0.700 | 0.400 |
| f | Number of Shares Owned | 200,000 | 250,000 |
| b*f | Dividend Income (IQD) | 140,000 | 100,000 |
| Second formula for Dividend Yield Calculation | |||
| a | Value of the Portfolio before the AGM (IQD) | 1,000,000 | 500,000 |
| e | Dividend Income (IQD) | 140,000 | 100,000 |
| e/a | Dividend Yield (%) | 14% | 20% |
The aim should be to focus on high yields, because with the same amount of invested money, your return will be higher in absolute terms. Although the invested value, share price of the stocks, and dividends paid per share may differ, dividend yield tells us whose return is higher in percentage terms.
What does dividend yield tell me, and how can I benefit from it when picking stocks to invest in?
The dividend yield indicates the return on investment from dividends alone, excluding any capital gains. The benefit of dividend yield is that it provides a standardized comparison among dividend-paying stocks with different share prices and dividends per share. This percentage return shows the return for any amount invested in different stocks.
In the Iraq Stock Exchange (ISX), the average dividend yield was 5.7% in 2023, as calculated by Rabee Securities (RS), considering the 23 companies that distributed dividends. This average was 4.3% in 2022, based on 21 companies that distributed dividends. Both the average dividend yield and the number of companies that distributed dividends increased in 2023 compared to 2022. An investor who wants to focus on dividend returns might invest in stocks that distribute dividends at a yield above the average.
Is a High Dividend Yield Good?
A high dividend yield can often be beneficial as it generates substantial income for income-focused investors. Additionally, a high yield sometimes indicates that a stock is undervalued, potentially providing a buying opportunity if the company has a strong financial position. However, investors should consider that when companies distribute most of their profits as dividends, the growth of their operations may be limited. This is because, instead of reinvesting profits into expanding operations, the companies allocate them to shareholders. When investing in high-dividend-yield stocks, investors should evaluate whether the companies’ high-yield dividends are sustainable and whether they have plans for operational growth.
Which Stock Has the Highest Dividend Yield?
In 2024, 21 out of 104 listed Iraq Stock Exchange (ISX) companies distributed dividend with an average dividend yield of 4.0%. International Development Bank (BIDB) paid the highest dividend yield in 2024 with 16.7%. The companies that pay dividend with a yield over the average dividend yield of 4.0% are as follows:
Banking sector:
International Development Bank (BIDB): 16.7%
Al Janoob Islamic Bank (BJAB): 6.1%
National Bank of Iraq (BNOI): 5.6%
Bank of Baghdad (BBOB): 4.1%
Telecom Sector:
Asiacell Communications PJSC (TASC): 8.8%
Agriculture Sector:
Iraqi for Seed Production (AISP): 7.2%
Industry Sector:
Baghdad Soft Drinks (IBSD): 7.0%
Iraqi For Tufted Carpets (IITC): 5.3%
Advantages and Disadvantages of Dividend Yields
The main advantages of dividend yields include income generation, signaling stability and a solid financial position, contributing to the total return on investment, reducing share price volatility, providing reinvestment opportunities that support compound returns, and offering attractive yields in low-interest environments.
The main disadvantages of dividend yields include the potential unsustainability of high yields, reduced growth potential if companies reinvest less in business expansion, thereby limiting their potential for capital appreciation. Additionally, high yields might be risky if they result from declining stock prices, as this could reflect underlying problems with the company.
As a result, when evaluating dividend yields, investors should consider the sustainability of dividend payments by checking payout ratios, decide whether to invest in growth-focused or income-oriented stocks, and ensure diversification in their investments.
What was the effect of dividends on the RSISXTR Index in 2024?
In February 2024, Rabee Securities introduced a separate “RSISX Total Return (RSISXTR) Index” (incorporating both price changes and dividend income) to better meet the market’s needs. When comparing the performance of the RSISX Index and the RSISXTR Index, the difference reflects the return obtained from the dividends distributed by the companies in the index, assuming they were withdrawn as cash rather than reinvested. The RSISXTR Index increased by 49.1% in the first 11 months of 2024, while the RSISX Index increased by 41.7% during the same period. The difference of 7.4% represents the return obtained from dividends, while the capital gain from the increase in share prices of index companies was 41.7%.
When share prices grow rapidly in a market, the primary focus of investors tends to be on capital gains. However, in Iraq, strong and well-managed companies often experience significant share price increases in addition to regular dividend distributions.
Dividend Yield vs. Dividend Payout Ratio
Dividend yield and dividend payout ratio are key ratios for evaluating dividend-paying stocks.
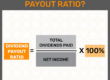
Dividend yield shows the return on investment from dividends relative to the stock price, while dividend payout ratio shows the proportion of a company’s earnings paid out as dividends.
While deciding which one to use, we need to consider that dividend yield is useful when comparing the income potential of stocks, while dividend payout ratio is important while evaluating whether a company can sustain its dividend payments over time.
These two key metrics measure different aspects of a company’s dividend performance. Please see below the comparison of the two in a table:
| Comparison of Dividend Yield & Dividend Payout Ratio | ||
| Dividend Yield | Dividend Payout Ratio | |
| What is the main focus? | Return on investment through dividends | Proportion of profits distributed |
| Tells what? | Attractiveness of a stock for income generation | Sustainability of dividends |
| Who should evaluate? | Income-focused investors | Investors assessing financial health |
| What affect it? | Stock price changes | Earnings changes |
FAQ
What is yield in stocks?
Yield for stocks typically refers to the dividend yield. Rabee Securities’ Research Department, in its Dividend Reports, calculates the dividend yield by dividing the dividend per share by the stock’s closing price just before the annual general meeting (AGM), where the decision to distribute the dividend is made. The divisor in the formula is called “ex-dividend date closing price”.